主要工具介绍 vector
vector 是基于rust 编写的高性能,数据可视化平台,支持数据的聚合以及可视化 10 倍。https://cloud.tencent.com/developer/article/2086757
vector官网 看一张性能对比图
目标
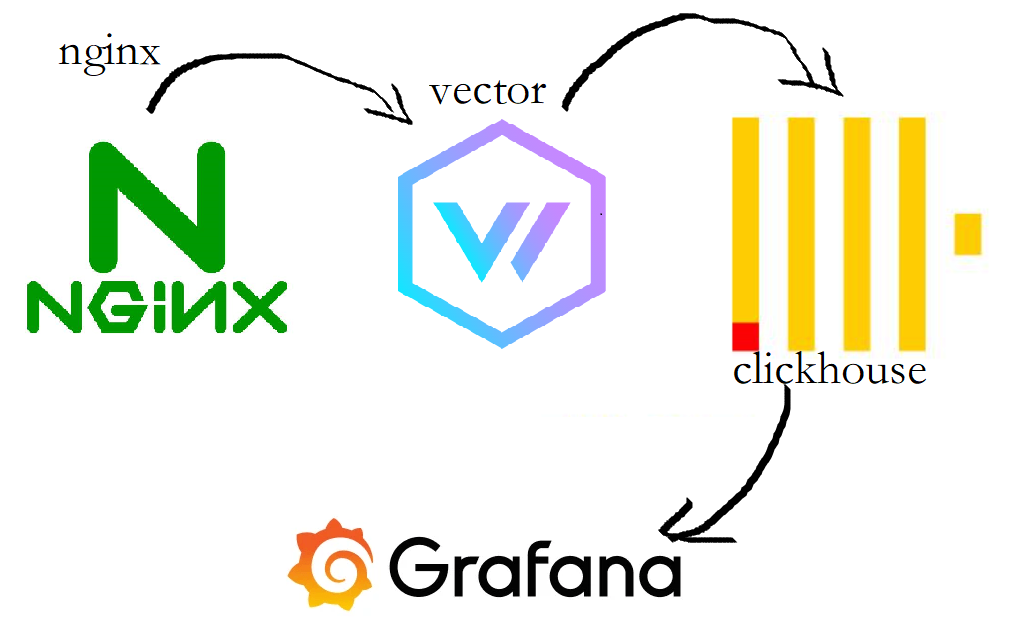
主要目标是利用grafana对nginx的日志数据进行可视化分析,但nginx产生的数据量在非常大的情况下,我们选择的数据库是不是合理的将会对图表数据的获取产生比较大的影响,列式的数据结构更加适合统计图对数据的要求,选择clickhouse作为nginx日志的持久化数据库非常合适
nginx 日志格式化
先对nginx access日志json格式化,如果对remap熟悉的话,可以在vector配置中transforms阶段来对日志做变换
1
2
3
4
5
6
7
8
9
10
11
12
13
14
15
16
17
18
19
20
21
22
log_format aka_logs '{"timestamp" :"$time_iso8601" ,' '"host" :"$hostname" ,' '"server_ip" :"$server_addr" ,' '"client_ip" :"$remote_addr" ,' '"xff" :"$http_x_forwarded_for" ,' '"domain" :"$host" ,' '"url" :"$uri" ,' '"referer" :"$http_referer" ,' '"args" :"$args" ,' '"upstreamtime" :"$upstream_response_time" ,' '"responsetime" :"$request_time" ,' '"request_method" :"$request_method" ,' '"status" :"$status" ,' '"size" :"$body_bytes_sent" ,' '"request_body" :"$request_body" ,' '"request_length" :"$request_length" ,' '"protocol" :"$server_protocol" ,' '"upstreamhost" :"$upstream_addr" ,' '"file_dir" :"$request_filename" ,' '"http_user_agent" :"$http_user_agent" ' '}';
安装Vector 使用脚本安装 1 curl --proto '=https' --tlsv1.2 -sSf https://sh.vector.dev | bash
配置
sinks先配置为print,将读取并处理后的log文件内容显示在控制台https://vector.dev/docs/reference/vrl/
1
2
3
4
5
6
7
8
9
10
11
12
13
14
15
16
17
18
19
20
21
22
23
24
25
26
27
28
[sources.nginx_access_log] type = "file" include = ["/www/wwwlogs/*_access.log" ]read_from = "end" [transforms.nginx_parse_logs] type = "remap" inputs = ["nginx_access_log" ]source = ''' . = parse_json!(.message) ''' [sinks.print] type = "console" inputs = ["nginx_parse_logs" ]encoding.codec = "json"
vector启动 1 ./vector --config config/vector.toml
访问下网站看看vector的输出是不是符合预期结果的
安装clickHouse 安装命令 1 2 3 4 5 6 7 8 9 10 11 12 13 14 15 sudo apt-get install apt-transport-https ca-certificates dirmngr sudo apt-key adv --keyserver hkp://keyserver.ubuntu.com:80 --recv E0C56BD4 echo "deb https://repo.clickhouse.tech/deb/stable/ main/" | sudo tee \ /etc/apt/sources.list.d/clickhouse.list sudo apt-get update sudo apt-get install -y clickhouse-server clickhouse-client sudo service clickhouse-server start # 连接 clickhouse-client
clickhouse默认安装后没有密码,后面需要添加密码 clickhouse-server启动后默认是只能本地访问,需要修改listen地址
clickHouse配置
设置密码
1 vim /etc/clickhouse-server/users.xml
打开远程访问
1 vim /etc/clickhouse-server/config.xml
开放8123、9000端口
1 2 3 4 5 ufw status ufw allow 8123 ufw allow 9000
http面板
request 1 http://127.0.0.1:8123/play
连接测试
建表(根据nginx日志结构建表)
根据nginx日志结构建表(nginx_log)
1 2 3 4 5 6 7 8 9 10 11 12 13 14 15 16 17 18 19 20 21 22 23 24 -- `default`.nginx_log definition CREATE TABLE `default`.nginx_log ( `timestamp` VARCHAR, host VARCHAR, server_ip VARCHAR, client_ip VARCHAR, xff VARCHAR, `domain` VARCHAR, url VARCHAR, referer VARCHAR, args VARCHAR, upstreamtime VARCHAR, responsetime VARCHAR, request_method VARCHAR, status VARCHAR, `size` VARCHAR, request_body VARCHAR, request_length VARCHAR, protocol VARCHAR, upstreamhost VARCHAR, file_dir VARCHAR, http_user_agent VARCHAR ) ENGINE = Log;
修改Vector sinks为clickhouse 1 2 3 4 5 6 7 8 9 10 11 12 13 14 15 16 17 18 19 20 21 22 23 24 25 26 27 28 29 30 31 32 33 34 35 36 37 38 39 40 41 [sinks.clickhouse] type = "clickhouse" inputs = ["nginx_client_ip" ]endpoint = "http://127.0.0.1:8123" database = "default" table = "nginx_log" skip_unknown_fields = true [sinks.clickhouse.auth] strategy = "basic" password = "zby123456" user = "default"
启动vector(将日志同步到clickhouse) 1 ./vector --config config/vector.toml
查看nginx_log表里有没有数据
可以看到nginx_log表中已经有了nginx的日志数据
grafana 建立数据图表 安装clickhouse插件
添加clickhouse数据源
创建dashboard
写在最后 在有大量的日志数据的支撑下,使用grafana可以对整个平台的请求情况进行很直观的统计和刻画,借助vector我实现了将nginx日志实时同步至clickhouse中;https://grafana.com/grafana/dashboards/